Cluster tendency assessment metrics on high-dimensional data

Background
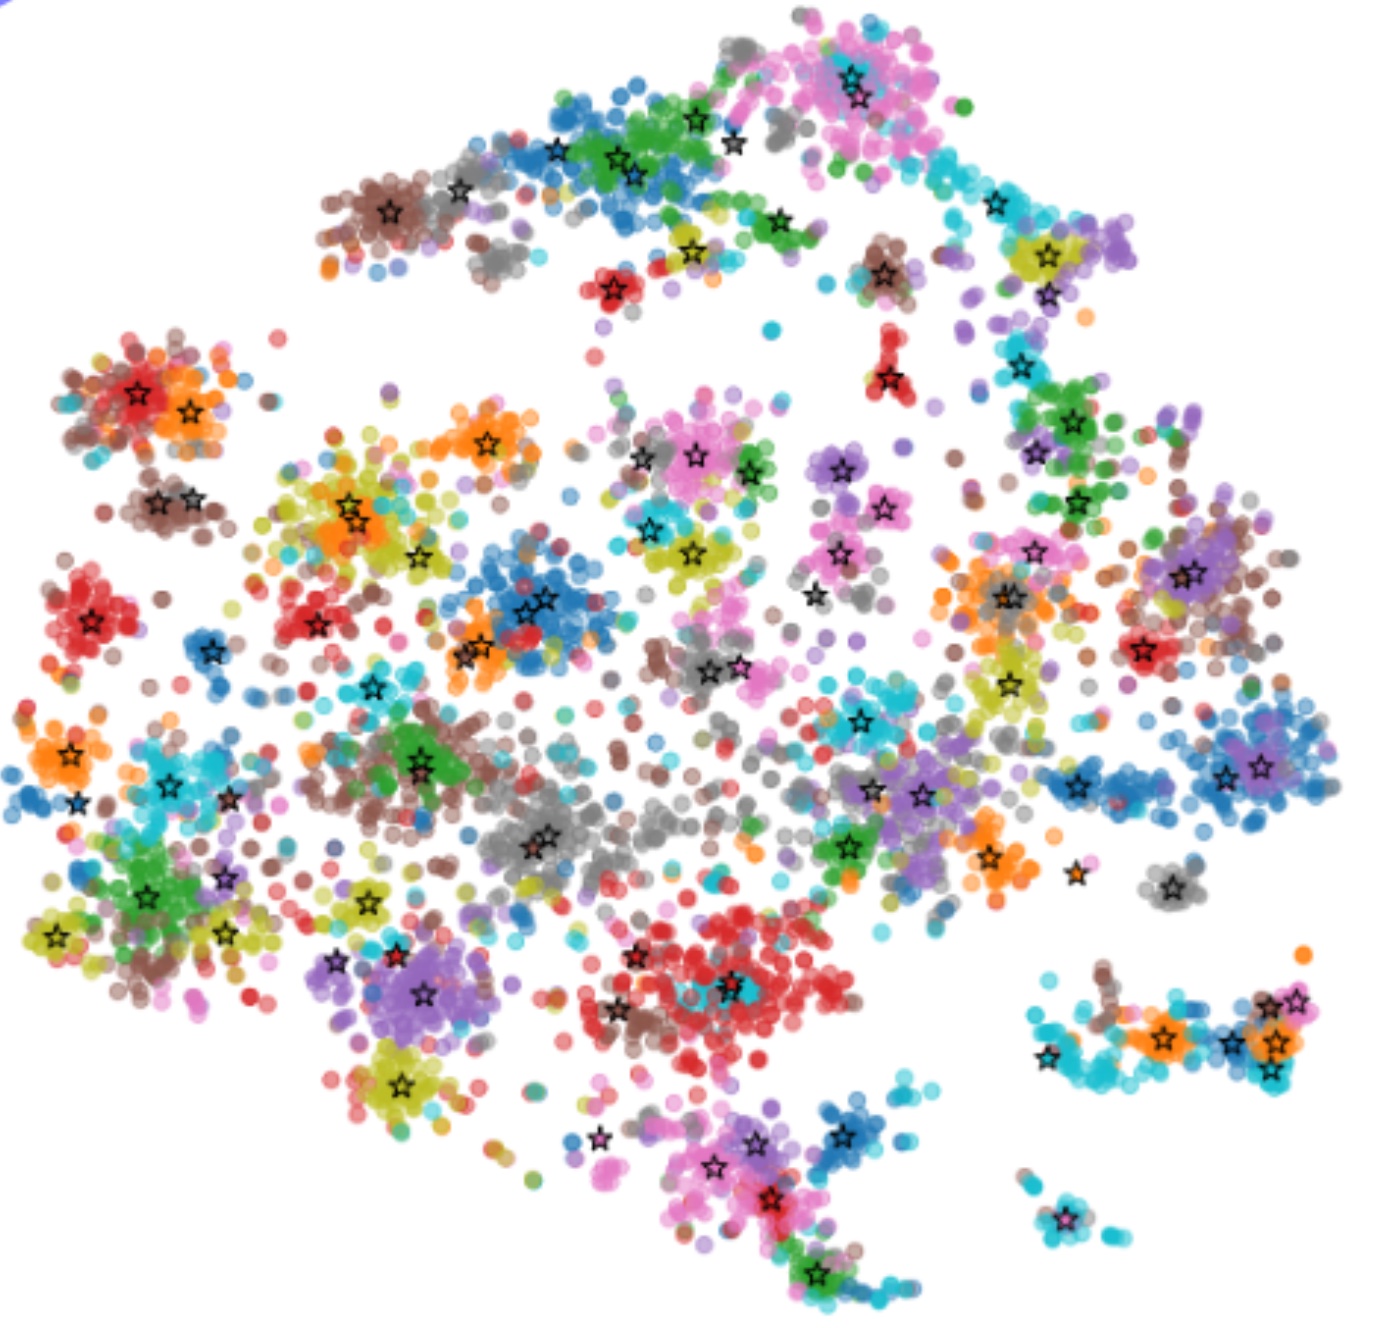
In many application areas, ranging from biology to economy, we analyse large and high-dimensional datasets and try to find patterns in the data. In this context, we often try to find out if the underlying data is separable into discrete clusters or if it forms a continuum. For instance, in neurobiology, we are intersted in the organization of neuron types in the brain. It is currently unknown how many distinct types of neurons exist and whether they have subtypes or form a wide spectrum of morphological, genetic and functional variation.
Bachelor’s/master’s thesis
Cluster tendency assessment metrics [1] have been developed to quantify how “clustered” a dataset is. However, when applied to high-dimensional datasets these metrics are difficult to interpret. For instance, what does a clustering index of 0.6 exactly mean? In this project, we are planning to generate synthetic datasets of varying complexity, for which we know and can control the statistics and the “clusteredness” of the underlying data. Using such synthetic datasets, we will study analytically and numerically different clustering tendency assessment metrics. The aim is to identify a robust metric for clustering tendency assessment on complex real-world data.
Requirements
- Statistical knowledge (multivariate probability distributions, high dimensional vector spaces, hypothesis testing)
- Python programming
- Data science background (scipy, sklearn, numpy, pandas)
Literature
[1] A New Method for determining the Type of Distribution of Plant Individuals
